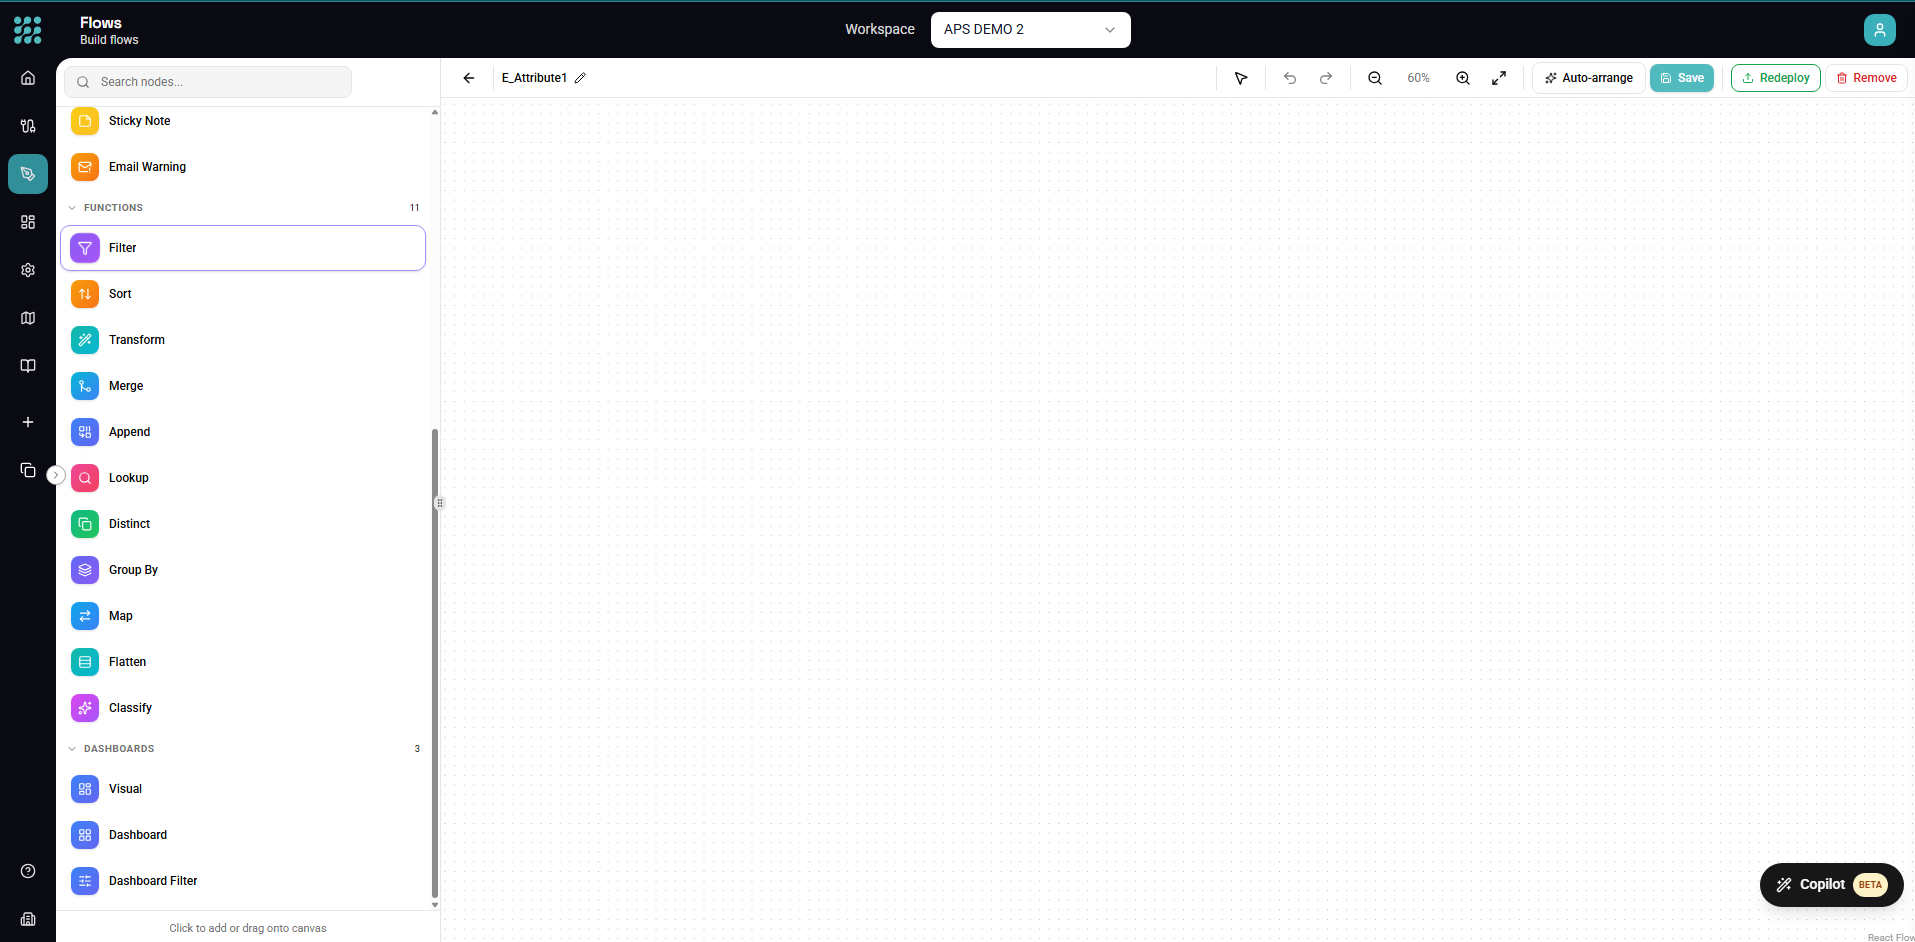
Transform Nodes

Transform nodes are the workhorses of your workflows. They sit between your data sources and outputs, processing and reshaping data as it flows through. FactoryThread provides 14 transform functions covering filtering, mapping, aggregating, joining, splitting, and converting data.

Transform Function Categories

Transform nodes fall into five categories based on what they do to your data:

CategoryFunctionsPurpose
Row SelectionFilter, Condition, DivideControl which rows pass through
Column OperationsMap, Transform, ConvertAdd, remove, rename, or modify columns
Combining DataMerge, Append, LookupJoin or stack data from multiple sources
AggregationGroup By, DistinctSummarize or deduplicate rows
Row ExpansionSplit, SortCreate additional rows or reorder data

Quick Reference

Before diving into each function, here's a quick decision guide:

I want to...Use this function
Keep only rows matching criteriaFilter
Route rows to different pathsDivide or Condition
Remove or rename columnsMap
Add calculated fieldsTransform
Change data typesConvert
Join two datasets on a keyMerge
Combine datasets verticallyAppend
Enrich data from a reference tableLookup
Calculate totals, averages, countsGroup By
Remove duplicate rowsDistinct
Expand delimited values to rowsSplit
Reorder rowsSort
Categorize text with AIAI Classify

Row Selection Functions

These functions control which rows continue through your workflow.

Filter

Purpose: Include or exclude rows based on conditions.

Filter is one of the most commonly used transforms. It evaluates each row against conditions you define and only passes through rows that match. Rows that don't match are discarded.

Key capabilities:

  • 14 comparison operators (equals, contains, greater than, is null, etc.)
  • AND/OR logic for combining conditions
  • Nested condition groups for complex rules
  • Case-sensitive or insensitive text matching

Common uses:

  • Remove invalid or incomplete records
  • Select data for a specific date range
  • Filter by status, category, or region
  • Exclude test or sample data

Example: Keep only orders from the last 30 days with status "Complete":

OrderDate >= [30 days ago]
AND Status equals "Complete"

📖 Full Filter Documentation — Complete guide with all operators and examples.


Divide

Purpose: Split data into multiple parallel branches based on conditions.

Divide works like a multi-way switch. Each row is evaluated and routed to one of several output branches based on which condition it matches. Unlike Filter, Divide doesn't discard data—it directs it to different processing paths.

Key capabilities:

  • Define 2-10 output branches
  • First-match or all-match routing
  • Default branch for unmatched rows
  • Each branch becomes a separate workflow path

Common uses:

  • Different processing for different regions
  • Separate success and error records
  • Priority-based routing
  • Type-specific transformations

Example: Route orders by priority:

Branch 1: Priority equals "Urgent" → Fast-track processing
Branch 2: Priority equals "Normal" → Standard processing
Default: → Review queue

📖 Full Divide Documentation — All branching patterns and configuration options.


Condition

Purpose: Add a flag column based on whether conditions are met.

Condition adds a new boolean column to your data indicating whether each row matches your criteria. Unlike Filter (which removes rows) or Divide (which routes rows), Condition keeps all rows and annotates them.

Key capabilities:

  • Adds true/false column to every row
  • Same condition builder as Filter
  • Custom column naming
  • Chain multiple conditions for complex flags

Common uses:

  • Flag records for review
  • Mark rows as valid/invalid
  • Identify exceptions
  • Pre-compute filter criteria

Example: Add "IsHighValue" column:

IF Amount > 10000 THEN true ELSE false

📖 Full Condition Documentation — Pattern examples and use cases.


Column Operations

These functions modify the columns in your data.

Map

Purpose: Select, rename, and reorder columns.

Map controls which columns appear in your output and what they're named. It's essential for cleaning up data, standardizing column names, and preparing data for destinations with specific schema requirements.

Key capabilities:

  • Include/exclude specific columns
  • Rename columns
  • Reorder columns
  • Bulk select/deselect

Common uses:

  • Remove unnecessary columns before export
  • Rename columns to match destination schema
  • Prepare data for merge operations (key alignment)
  • Simplify data for downstream processing

Example: Rename and select columns:

customer_name → CustomerName (include)
customer_id → CustomerID (include)
internal_notes → (exclude)
created_timestamp → CreatedDate (include)

📖 Full Map Documentation — Column management patterns.


Transform

Purpose: Create new calculated columns using expressions.

Transform is the most flexible function. It lets you create new columns by applying formulas, combining existing fields, performing calculations, and using built-in functions. Think of it as adding computed columns to a spreadsheet.

Key capabilities:

  • 80+ built-in functions (text, math, date, logic)
  • Field references with ${FieldName} syntax
  • Visual expression builder
  • Multiple transforms in one node

Function categories:

  • Text: CONCAT, UPPER, LOWER, TRIM, SUBSTRING, REPLACE, SPLIT
  • Math: +, -, *, /, ABS, ROUND, FLOOR, CEILING, MOD
  • Date: YEAR, MONTH, DAY, DATEDIFF, DATEADD, NOW, TODAY
  • Logic: IF, CASE, COALESCE, ISNULL, NULLIF
  • Conversion: CAST, TODATE, TONUMBER, TOTEXT

Example: Create full address:

CONCAT(${Street}, ", ", ${City}, ", ", ${State}, " ", ${ZipCode})

📖 Full Transform Documentation — Complete function reference and expression guide.


Convert

Purpose: Change column data types.

Convert changes the data type of columns—turning text to numbers, strings to dates, numbers to booleans, and more. It's essential when your source data has incorrect types or when preparing data for destinations with strict type requirements.

Key capabilities:

  • Text ↔ Number conversions
  • Text → Date with format patterns
  • Text ↔ Boolean with custom mappings
  • Number formatting and precision control
  • Error handling options

Supported conversions:

FromToExample
TextNumber"123.45" → 123.45
TextDate"01/15/2024" → 2024-01-15
TextBoolean"Yes" → true
NumberText1234.5 → "1,234.50"
DateText2024-01-15 → "January 15, 2024"
BooleanNumbertrue → 1

📖 Full Convert Documentation — All type conversions and format patterns.


Combining Data

These functions merge data from multiple sources.

Merge

Purpose: Join two datasets based on matching key columns.

Merge combines rows from two inputs where specified columns match—like a SQL JOIN or Excel VLOOKUP. It's essential for enriching data from one source with information from another.

Key capabilities:

  • Inner, Left, Right, and Full join types
  • Single or composite keys
  • Handle duplicate matches
  • Column conflict resolution

Join types explained:

TypeResult
InnerOnly rows that exist in both datasets
LeftAll rows from left + matching from right
RightMatching from left + all rows from right
FullAll rows from both (nulls where no match)

Example: Join orders with customer details:

Left: Orders (OrderID, CustomerID, Amount)
Right: Customers (CustomerID, Name, Email)
Join: Orders.CustomerID = Customers.CustomerID
Type: Left (keep all orders)
Result: OrderID, CustomerID, Amount, Name, Email

📖 Full Merge Documentation — Join strategies and performance tips.


Append

Purpose: Stack data from multiple sources vertically.

Append combines rows from two inputs into a single output—adding the rows from the second input after the rows from the first. Unlike Merge (which joins columns), Append stacks rows. It's like SQL UNION.

Key capabilities:

  • Combine rows from any number of sources
  • Column matching by name or position
  • Handle schema mismatches
  • Deduplicate option

When to use:

  • Combining monthly data files
  • Merging data from similar sources
  • Aggregating regional datasets
  • Stacking before/after comparisons

Example: Combine Q1-Q4 sales data:

Input 1: Q1_Sales (1,000 rows)
Input 2: Q2_Sales (1,200 rows)
Input 3: Q3_Sales (950 rows)
Input 4: Q4_Sales (1,100 rows)
Output: AllSales (4,250 rows)

📖 Full Append Documentation — Schema handling and patterns.


Lookup

Purpose: Enrich data by looking up values from a reference table.

Lookup adds columns to your data by finding matching rows in a reference dataset. It's optimized for the common pattern of enriching a main dataset with reference data—like looking up product prices, customer details, or code descriptions.

Key capabilities:

  • Single or composite lookup keys
  • Multiple return columns
  • Configurable no-match behavior
  • Caching for performance

Difference from Merge:

  • Lookup is optimized for reference data enrichment
  • Lookup handles the common "one main, one reference" pattern
  • Merge is more flexible for complex join scenarios

Example: Look up product prices:

Main: OrderLines (ProductCode, Quantity)
Lookup: Products (Code, Price, Description)
Match: OrderLines.ProductCode = Products.Code
Return: Price, Description

📖 Full Lookup Documentation — Optimization and caching strategies.


Aggregation

These functions summarize or deduplicate your data.

Group By

Purpose: Aggregate rows by grouping columns.

Group By combines multiple rows into summary rows based on grouping keys. It calculates aggregate values like sums, counts, averages, and min/max for each group. The output has one row per unique combination of grouping columns.

Key capabilities:

  • Multiple grouping columns
  • 7 aggregate functions (SUM, COUNT, AVG, MIN, MAX, FIRST, LAST)
  • Multiple aggregations per group
  • Null handling options

Aggregate functions:

FunctionDescriptionWorks With
SUMAdd all valuesNumbers
COUNTCount rowsAny
AVGCalculate meanNumbers
MINFind smallestNumbers, Dates, Text
MAXFind largestNumbers, Dates, Text
FIRSTFirst value in groupAny
LASTLast value in groupAny

Example: Sales by region and product:

Group by: Region, ProductCategory
SUM: SalesAmount → TotalSales
COUNT: OrderID → OrderCount
AVG: SalesAmount → AvgOrderValue

📖 Full Group By Documentation — Aggregation patterns and examples.


Distinct

Purpose: Remove duplicate rows.

Distinct keeps only unique rows based on all or selected columns. When duplicates are found, it keeps the first occurrence and discards the rest.

Key capabilities:

  • Compare all columns or selected subset
  • Keep first or last occurrence
  • Count duplicates removed
  • Preserve original order

Common uses:

  • Deduplicate after merging data
  • Get unique values from a column
  • Clean up dirty data
  • Prepare data for loading

Example: Remove duplicate customer records:

Distinct on: Email, Phone
Keep: First occurrence
Result: One row per unique email+phone combination

📖 Full Distinct Documentation — Deduplication strategies.


Row Expansion and Ordering

These functions change the number or order of rows.

Split

Purpose: Expand rows by splitting delimited values.

Split takes a column containing delimited values (like "a,b,c") and creates multiple rows—one for each value. All other columns are duplicated for each new row. It's the opposite of Group By.

Key capabilities:

  • Custom delimiter support
  • Split to array elements
  • Preserve original row option
  • Handle empty values

Example: Expand product tags:

Before:
| ProductID | Tags |
|-----------|-------------------|
| 1 | "red,blue,green" |

After (split on comma):
| ProductID | Tag |
|-----------|-------|
| 1 | red |
| 1 | blue |
| 1 | green |

📖 Full Split Documentation — Delimiter patterns and edge cases.


Sort

Purpose: Reorder rows by column values.

Sort arranges rows in ascending or descending order based on one or more columns. Multi-column sorting applies each sort in sequence.

Key capabilities:

  • Ascending or descending order
  • Multiple sort columns
  • Null handling (first or last)
  • Stable sort (preserves original order for ties)

Example: Sort orders by date (newest first), then by amount:

Sort 1: OrderDate (Descending)
Sort 2: Amount (Descending)

📖 Full Sort Documentation — Multi-column sorting and performance.


AI-Powered Transforms

AI Classify

Purpose: Categorize text data using AI.

AI Classify uses large language models (via your AI connection) to categorize text values into predefined categories. It's ideal for classifying unstructured text that would be difficult to categorize with rules.

Key capabilities:

  • Connect to OpenAI or Azure OpenAI
  • Define custom categories with descriptions
  • Confidence scores
  • Batch processing for efficiency

Common uses:

  • Classify support tickets by type
  • Categorize customer feedback sentiment
  • Route documents by topic
  • Tag products by description

Example: Classify support tickets:

Categories:
- "Bug Report" - Customer reporting a software bug or error
- "Feature Request" - Request for new functionality
- "Question" - General inquiry about product usage
- "Complaint" - Expression of dissatisfaction

Input: TicketDescription
Output: TicketCategory, ConfidenceScore

Choosing the Right Transform

Decision Tree

Do you need to reduce the number of rows?
├── Yes → Are you removing rows entirely?
│ ├── Yes → Use Filter
│ └── No (routing) → Use Divide
└── No → Continue...

Do you need to change columns?
├── Add new calculated columns → Use Transform
├── Rename or remove columns → Use Map
├── Change data types → Use Convert
└── No → Continue...

Do you need to combine data?
├── From the same source (stacking) → Use Append
├── From different sources (joining) → Use Merge or Lookup
└── No → Continue...

Do you need to aggregate?
├── Summarize with totals/counts → Use Group By
├── Just remove duplicates → Use Distinct
└── No → Continue...

Do you need to expand rows?
├── Split delimited values → Use Split
└── No → Continue...

Do you need to reorder rows?
└── Use Sort

Common Patterns

Pattern 1: Data Cleanup Pipeline

Entity → Filter (remove invalids) → Map (select columns) → Convert (fix types) → Transform (add calculations)

Pattern 2: Data Enrichment

Main Entity → Merge (join reference data) → Transform (calculate totals) → Map (select final columns)

Pattern 3: Aggregation Report

Entity → Filter (date range) → Group By (aggregate) → Sort (order results) → Response

Pattern 4: Multi-Source Consolidation

Entity A ─┐
Entity B ─┼→ Append → Distinct (dedupe) → Transform → Output
Entity C ─┘

Transform Performance Tips

Order Matters

The sequence of your transforms affects performance:

  1. Filter first — Remove unwanted rows before heavy processing
  2. Map early — Drop unnecessary columns to reduce data size
  3. Aggregate before output — Summarize to reduce row counts
  4. Transform last — Calculate fields on the filtered/reduced dataset

Memory Considerations

Some transforms hold data in memory:

TransformMemory Usage
Filter, Map, Transform, ConvertLow (stream)
Sort, Group By, DistinctModerate (buffer)
Merge, LookupHigher (one dataset in memory)
AppendLow (stream)

For very large datasets:

  • Filter early to reduce data volume
  • Use database-level filtering when possible
  • Consider chunking with Divide

Next Steps