Quick Start Guide
This guide walks you through creating your first data workflow in FactoryThread. In about 5 minutes, you'll connect to a data source, transform data, and preview the results.
Prerequisites
Before you begin, make sure you have:
- Access to a FactoryThread workspace
- A data source to connect to (database, Excel file, or API)
If you don't have a data source ready, you can upload an Excel file to get started quickly.
Step 1: Create a Connection
Connections are how FactoryThread accesses your data. Let's create one:
- Click Connections in the left sidebar
- Click the + New Connection button
- Select your connection type:
- SQL for SQL Server databases
- Redshift for Amazon Redshift
- Upload for Excel or CSV files
- API for REST endpoints
- OpenAI for AI services
For a Database Connection
- Select SQL or your database type
- Enter a descriptive Name (e.g., "Sales Database")
- Fill in the connection details:
- Server - your database server hostname
- Database - the database name
- Username and Password
- Click Test Connection to verify it works
- Click Save
For a File Upload
- Select Upload
- Enter a Name for your connection
- Click Choose File and select your Excel or CSV file
- Click Save
Once saved, FactoryThread automatically discovers all tables, sheets, or endpoints in your connection.
Step 2: Open the Designer
The Designer is where you build workflows visually:
- Click Flows in the left sidebar
- You'll see your existing flows organized in folders
- Click + New in the top toolbar
- Select Flow to start a new Flow
Faster: instead of building by hand, describe what you want to Copilot and it assembles the Flow for you.
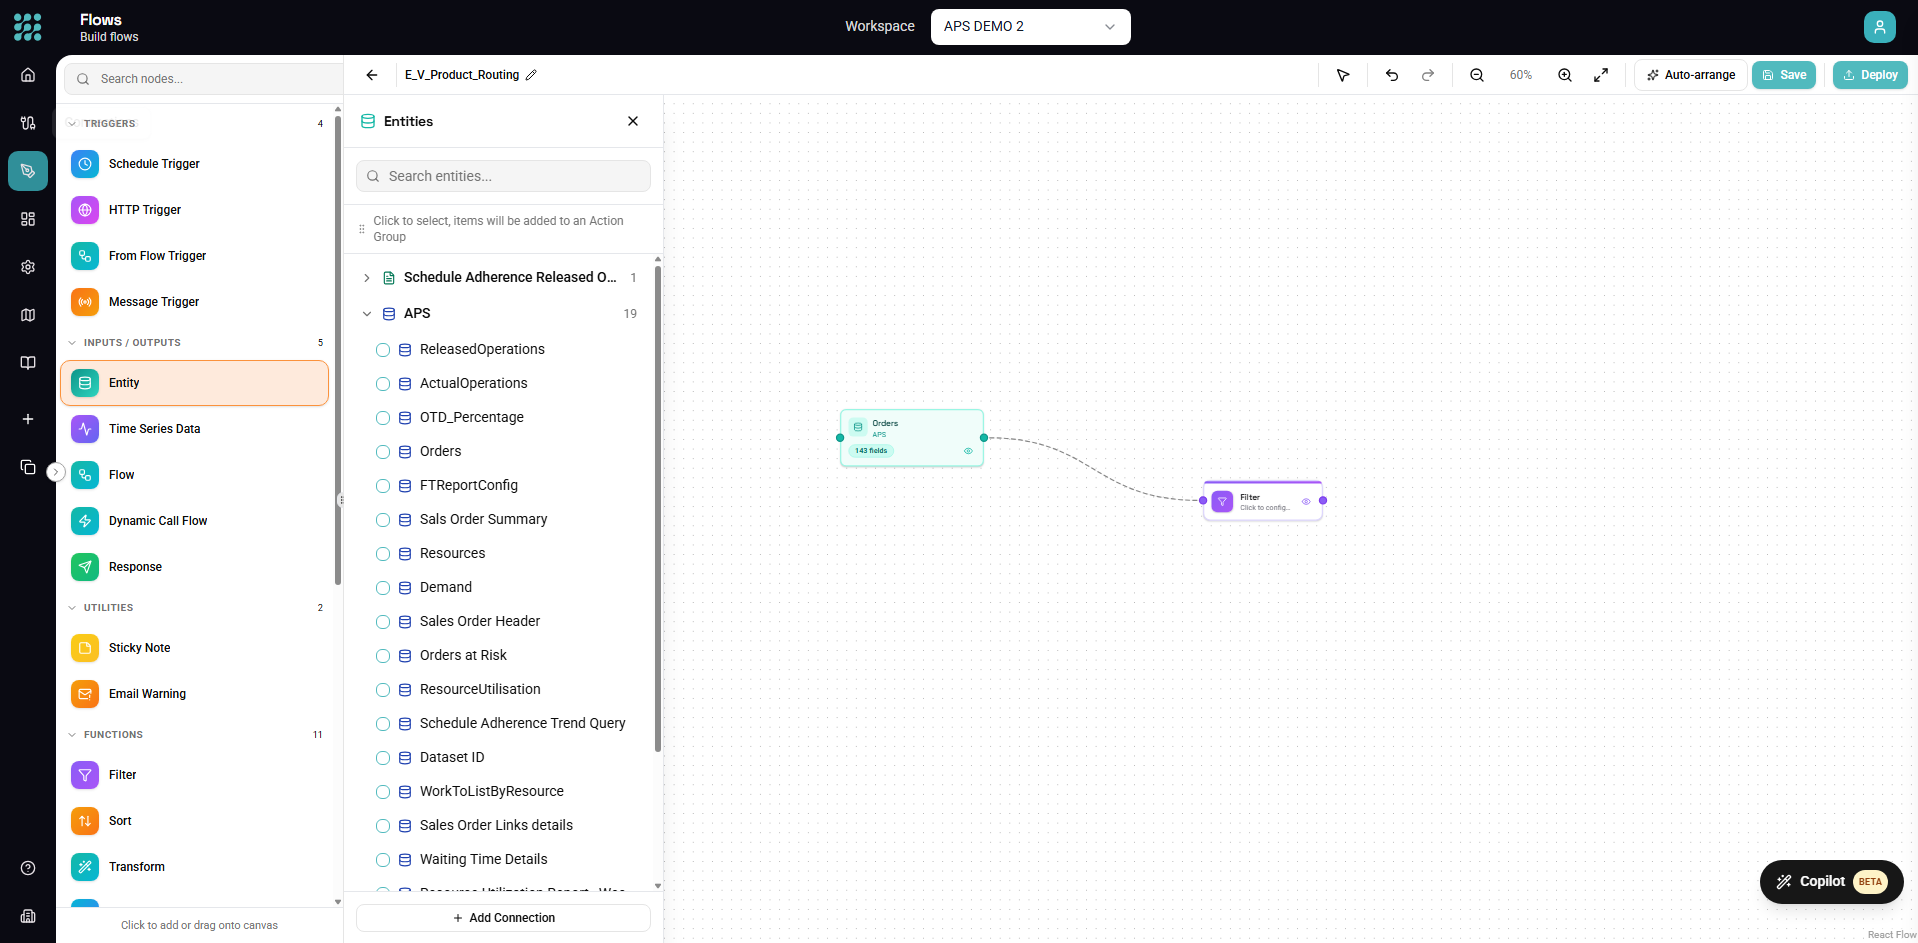
Step 3: Add a Data Source
Now let's pull data into your workflow:
- In the left panel, you'll see your connections listed
- Expand your connection to see available entities (tables/sheets)
- Drag an entity onto the canvas, or:
- Click the Entity button in the toolbar to open the entity selector
Tip: You can select multiple entities at once by holding Cmd (Mac) or Ctrl (Windows) and clicking each one, then dragging them all onto the canvas.
Once added, you'll see an entity node on the canvas representing your data source.
Step 4: Preview Your Data
Before transforming, let's see what data we're working with:
- Click on the entity node to select it
- Click the Preview button in the toolbar (or press Cmd/Ctrl + Enter)
- A dialog appears showing your data in a table
The preview shows the first rows of your data, column names, and data types. This helps you understand your data before adding transformations.
Step 5: Add a Transformation
Let's filter the data to show only relevant rows:
- From the left panel, find Filter under Functions
- Drag the Filter node onto the canvas
- Connect the entity node to the filter node:
- Click and drag from the right handle of the entity node
- Drop onto the left handle of the filter node
- Click the Filter node to open its configuration panel
Configure the Filter
In the Filter configuration panel:
- Click Add Condition
- Select a Field to filter on (e.g., "Status")
- Choose an Operator (e.g., "equals")
- Enter a Value (e.g., "Active")
- The filter configuration auto-saves
Step 6: Preview the Results
Let's see the filtered results:
- Click on the Filter node
- Click Preview in the toolbar
- You should now see only rows matching your filter condition
The preview always shows data at the selected node, so you can check results at any point in your workflow.
Step 7: Save Your Work
Your workflow auto-saves as you work, but you can also manually save:
- Click the Save button in the toolbar (or press Cmd/Ctrl + S)
- Give your Flow a descriptive name if prompted
What's Next?
Congratulations! You've built your first data workflow. Here's what you can explore next:
Add More Transformations
Try adding other transformation nodes:
- Formula - Add or change columns with expressions
- Map - Reshape rows into a different structure
- Group By - Aggregate data (sum, count, average)
- Merge - Join data from multiple sources
- Distinct - Remove duplicate rows
Automate it
To run your Flow automatically:
- Add a Trigger — Schedule, HTTP, or Message — or leave it trigger-less to run on demand
- Add an output, such as a Response or a write-back to a source system
- Click Publish to make the Flow runnable in production
Monitor Executions
After deploying a flow:
- Go to Dashboard to see execution metrics
- Go to Insights for detailed execution history
- Click any execution to see input, output, and errors
Keyboard Shortcuts
Speed up your workflow building with these shortcuts:
| Shortcut | Action |
|---|---|
| Cmd/Ctrl + S | Save |
| Cmd/Ctrl + Z | Undo |
| Cmd/Ctrl + Shift + Z | Redo |
| Cmd/Ctrl + Enter | Preview |
| Delete | Delete selected node |
| ? | Open help panel |
Need Help?
- Press ? to open the help panel with contextual documentation
- Check the Designer Overview for detailed guidance
- Visit Troubleshooting for common issues