Group By
The Group By node rolls rows up into summaries: it collapses rows that share the same values in your grouping fields into a single output row, and computes aggregate values across each group. It is the tool for reports, totals, and analytics from detailed data.
How it works
- Rows with matching values in the grouping fields are collected into a group.
- Each aggregate is computed across the rows in that group.
- The node outputs one row per group.
Input:  10 orders across 3 customers
Output: 3 rows (one per customer) with order totals
Group By reduces rows — the detail is discarded. If you need to keep the detail rows while adding a summary alongside, use the Map node's summary feature instead.
Adding a Group By
- Drag Group By from the Functions section of the Element Panel.
- Connect it to a data source or upstream node.
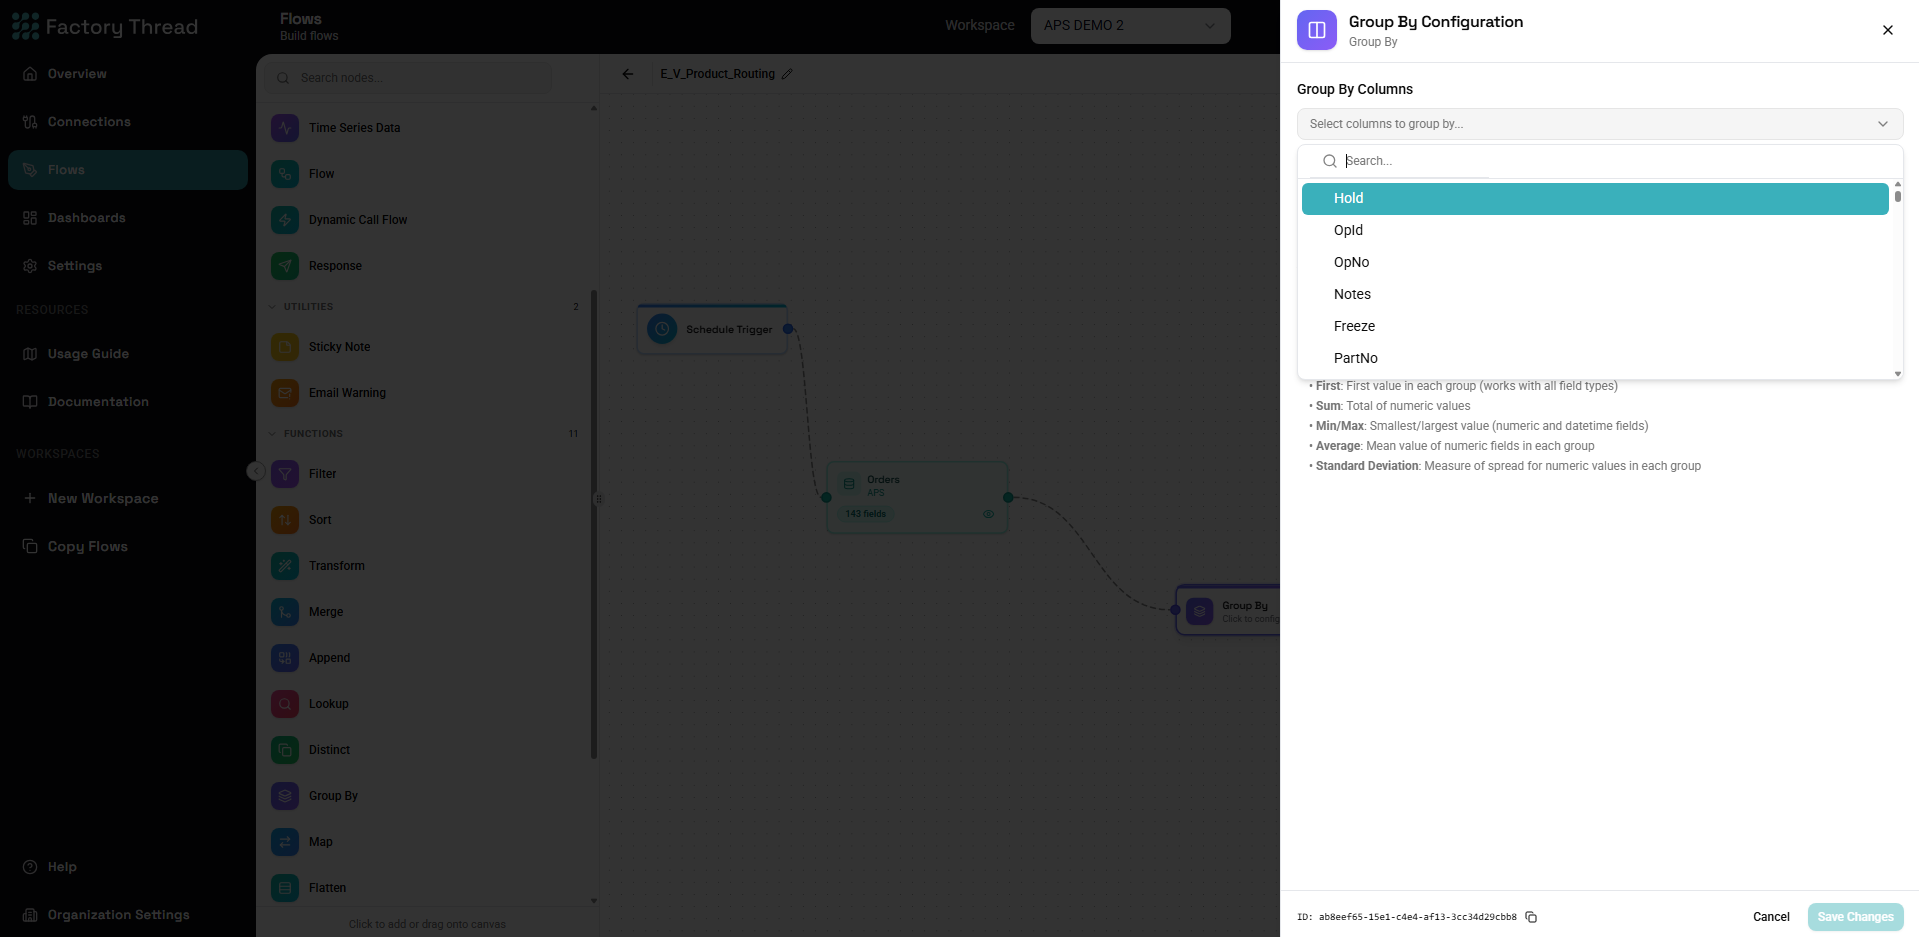
- Open the panel to choose grouping fields and aggregates.
Grouping fields
Add one or more fields that define the groups:
- One field —
Region→ one row per region. - Multiple fields —
Region,Year→ one row per region-and-year combination.
Rows where a grouping field is NULL are grouped together into a single "no
value" group. To label them, add a Formula upstream:
COALESCE(Region, "Unknown").
Aggregates
Each aggregate produces one output column. Pick a column and an aggregate function from the dropdown:
| Aggregate | What it returns |
|---|---|
| Count | The number of rows in the group |
| Sum | The total of a numeric column |
| Average | The mean of a numeric column |
| Min | The smallest value (earliest date / lowest number) |
| Max | The largest value (latest date / highest number) |
| First | The first value seen in the group |
| Standard Deviation | The population standard deviation of a numeric column |
The aggregates offered depend on the column's type — Average, Sum, and Standard Deviation apply to numbers only, while Count, Min, Max, and First work for any type.
How nulls and types are handled
These follow the shared strict-SQL semantics:
- Aggregates ignore NULLs —
AverageandSumskip empty values rather than treating them as zero. - A group in which every value is
NULLaggregates toNULL(an empty result), not0. - Numeric strings are coerced where possible, so a
"42"stored as text still sums correctly.
Example
Grouping: Region
Aggregates:
| Aggregate | Column | Output column |
|---|---|---|
| Count | — | OrderCount |
| Sum | Revenue | TotalRevenue |
| Average | Revenue | AvgOrderValue |
| Max | OrderDate | LastOrder |
Output:
| Region | OrderCount | TotalRevenue | AvgOrderValue | LastOrder |
|---|---|---|---|---|
| East | 150 | 45000 | 300 | 2025-03-29 |
| West | 120 | 52000 | 433 | 2025-03-31 |
Common patterns
Filter the groups (like SQL HAVING)
Aggregates can only be filtered after they are computed. Place a Filter after the Group By:
[Orders] → [Group By: CustomerID] → [Filter: TotalAmount > 10000]
Derive ratios from aggregates
Add a Formula after the Group By to compute values from the aggregate columns:
Name:       AvgOrderValue
Expression: TotalRevenue / OrderCount
Group by a date part
The grouping is by exact value, so to group by month or day, compute the key first with a Formula upstream:
Name:       YearMonth
Expression: FORMAT_DATE(OrderDate, "YYYY-MM")
Then group by YearMonth.
Tips
- Filter before grouping to reduce the rows the aggregation has to scan.
- Standardize grouping values (trim whitespace, normalize case with a
Formula) so near-duplicates like
"East "and"East"don't split a group. - Preview to confirm the group count matches what you expect.
Next steps
- Expression Language — the aggregate null/type semantics
- Formula — derive metrics from aggregate columns
- Filter — keep only the groups you want
- Map — summarize a group while keeping its detail rows